
GLEC Framework 2025: The Ultimate Guide to ISO 14083 & Sustainable Logistics
Introduction: Why GLEC and SFC Matter in 2025
As global trade rebounds and sustainability becomes a non-negotiable priority, businesses are increasingly focused on reducing their carbon footprint. The Smart Freight Centre (SFC) and its Global Logistics Emissions Council (GLEC) Framework are at the forefront of this transformation, providing the only globally recognised methodology for calculating and reporting CO2e emissions across multi-modal supply chains.
In 2025, the GLEC Framework has evolved to align with the new ISO 14083 standard, ensuring even greater accuracy and consistency in emissions reporting. This post explains what SFC and GLEC accreditation mean, how CO2e emissions are calculated, and why these standards are critical for modern logistics and cold chain operations.
What Does SFC Stand For?
SFC (Smart Freight Center) is a global non-profit organisation founded in 2013. Its mission is to make the freight sector more sustainable, efficient, and competitive by reducing carbon emissions, fuel waste, and pollution. SFC works with shippers, carriers, and logistics providers to implement best practices and standardised methodologies, such as the GLEC Framework.
What Is the GLEC Framework?
The GLEC Framework is the world’s first and only standardised methodology for calculating and reporting greenhouse gas (GHG) emissions from logistics operations. Developed by SFC in 2016, it aligns with the Greenhouse Gas Protocol.
Key Updates in GLEC 2025
The framework covers all transport modes, including ocean, road, rail, and air freight, ensuring comprehensive emissions tracking.
- Alignment with ISO 14083: The GLEC Framework now fully integrates with the ISO 14083 standard, providing a unified approach to emissions quantification.
- Enhanced Data Granularity: Companies can now use more detailed modelling and primary data for higher accuracy in CO2e calculations.
Why Is GLEC Accreditation Important?
GLEC accreditation ensures that your emissions calculations are transparent, consistent, and compliant with global standards. It helps businesses:
- Meet regulatory requirements such as CSRD but also valid for EU ETS
- Improve sustainability reporting for stakeholders.
- Identify opportunities to reduce emissions and operational costs.
How Are CO2e Emissions Calculated Under GLEC?
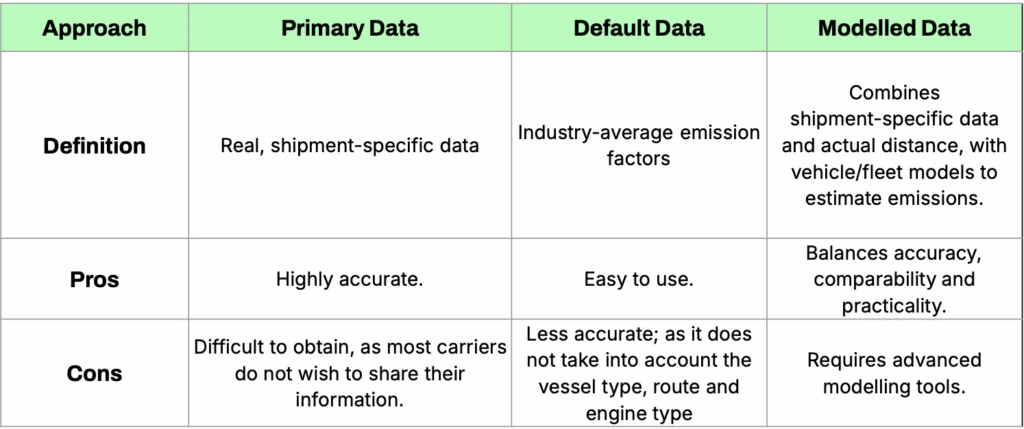
CO2e (carbon dioxide equivalent) is a standard unit for measuring the global warming potential of all greenhouse gases, including methane (CH4) and nitrous oxide (N2O). The GLEC Framework supports three main approaches to CO2e calculation:
How to Choose a GLEC-Compliant CO2e Calculator
When selecting a partner for emissions calculation, ask:
- Is your methodology GLEC-accredited? You should consider it a requirement.
- What data sources do you use? (Primary, default, or modelled?)
- Which parameters are included? (Cargo type, vehicle specs, fuel, speed?) confirm that your exact needs are covered by the partner.
- Can you handle Scope 3 emissions reporting?
For a GLEC-accredited solution, explore Searoutes’ Freight Emissions Reporter, which provides vessel-specific CO2e calculations compliant with ISO 14083 and GLEC.
Conclusion: Take Action for Sustainable Logistics and Outlook for 2026
The GLEC Framework and SFC accreditation are more than just compliance tools but catalysts for transforming global logistics into a sustainable, efficient, and transparent industry. As businesses face increasing pressure from regulators, customers, and investors to reduce their carbon footprint, adopting GLEC-compliant solutions is essential.
What’s Next for GLEC in 2026?
The evolution of the GLEC Framework is closely tied to global sustainability goals and technological advancements. Here’s what to expect in 2026: A Stricter Alignment with Global Regulations such as the EU ETS and similar schemes to expand. Hence the GLEC Framework will likely incorporate more granular requirements for emissions reporting, ensuring seamless compliance for businesses operating in multiple regions.
As soon as we hear more on the topic, we will update this article.
Take Action Today
The time to act is now. By adopting GLEC-compliant tools and practices, your business can not only meet current regulatory demands but also future-proof your operations for 2026 and beyond.
Next Steps:
- Explore Searoutes’ Freight Emissions Reporter: Achieve compliance with GLEC and ISO 14083 standards through vessel-specific CO2e calculations.
- Download our Clean transportation White Paper: Stay informed about regulatory changes and their impact on your operations.
- Book a meeting with Josie Hansen: Discuss how Searoutes can tailor solutions to your sustainability goals and prepare you for the future of logistics.
By embracing the GLEC Framework and ISO compliance today, you’re not just keeping pace with industry standards—you’re leading the charge toward a greener, more resilient global trade ecosystem.
Updated – sept 2025
Clean transportation solutions, GLEC Framework 2025, GLEC-compliant tools, ISO 14083 compliance, SFC accreditation, Smart Freight Centre (SFC)