3 ways to reduce co2 emissions from sea freight
Remember that reducing CO2 in the logistics is a multipoint process. Historically, shippers — companies who need to move goods from point A to point B — have access to a quarterly report built atop their shipment history. This report summarizes scope 3 emissions, i.e. all emissions related to moving goods, and aggregates them per mode, to present a synthetic view of emissions. In essence that report is static, it presents one KPI — the quarterly CO2e emissions — with which companies are left to adjust their CSR strategy, iterate, find ways to reduce that number at the next cycle. This iterative process is slow, every quarter comes one more data point. And it is essentially impossible to relate that figure to a cause. Are emissions up because we had a better quarter, because sales increased, or is it because our logistics and operations suffered. Is it down because we use greener transporters?
Reducing CO2 emissions, a matter of data.
To make things worse, CSR managers are often left to propose solutions independently of sourcing and logistics. It is difficult to present evidence supporting a particular CO2 reduction strategy over another. And, to add fuel to the fire, the evidence gathered relies too often on data coming from carriers — which is difficult to compare, and sometimes difficult to trust! — or from emissions calculators with outdated methodologies. Too often, we see initiatives based on the (measure — compensate) cycle. What if I told you there is another way?
There is a simple CSR strategy you can implement immediately. It is based around iterations on the (tender — source — report) cycle. All you need is better data. Before looking into it, let’s imagine you are VP Procurement at a large shipper, and that your KPI is to reduce the cost of freight in year n+1. What tools do you put in place, which actions do you take?
Most likely, you will seek transparency on your buying price, for a certain volume on a given route. You will want to compare it across carriers during tenders. During the quarter, procurement will execute on the nominated routes. And, at the end of the quarter, you will review the shipments actually done, and reconciliate. You’ll use the results of reconciliation in the next tender, to improve your bottom line.
As VP CSR seeking to reduce the GHG Emissions of freight — your scope 3! — your strategy is exactly the same: nominate (tender) — measure (spot) — learn (report). Let’s see it work in practice.
Tender — Know your CO2 per services.
In previous blog posts, you have seen how CO2 can be measured either using default data, detailed modeling or primary data. At Searoutes, we’re using detailed modeling to estimate the amount of emissions a vessel emits, for a particular route between a port pair, at a particular speed. We use schedule data and routing algorithms to reconstitute the fleets operation between port pairs, for each carrier and their alliance. The result is what we call a “CO2 risk profile”, per carrier. That risk profile allows shippers to choose a particular carrier during tender, given a CO2 target set by CSR.
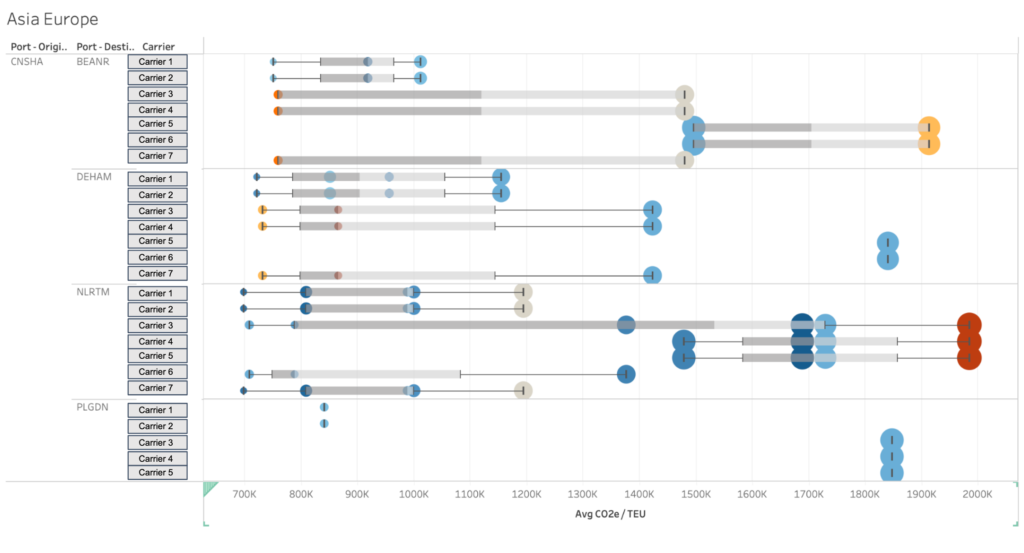
In the picture bellow, we show for each route, and for each carrier, the average CO2e emissions per TEU. CO2 values are reported on the x axis, and routes & carriers are on the y axis. Each circle represents an offering by a carrier, or service, on which it operates a fleet. The diameter of a circle shows the heterogeneity of a fleet on that service, it’s the standard deviation of CO2 on that service. A small circle means all the vessels on that service are about the same age, and sail at the same speed, to emit similar CO2e / TEU. A large circle means there are very different vessels sailing the same service, in tonnage, speed and age. Finally the color of circles shows how fast a particular service is: a blue circle means a short transit time, and an orange circle shows a long transit time.

When looking at this picture, there are 2 immediate remarks to be made. First, different carriers end up with similar CO2 risk profiles. How can that be? The answers lies in the fact that carriers, via their alliance mechanics, share the same fleets on a particular service. Therefore the CO2, and its standard deviation, are similar for carriers offering the same port pairs, across the same alliance. Second, high Co2e values (right of the picture) correlate with higher transit times (orange circles). Likewise, low CO2e values (left of the picture) correlate with shorter transit times (dark blue circles). This is immediate, since longer vessel rotations mean longer transit times, and therefore longer distances, so higher emissions. It shows that distance naturally has an impact on both CO2 emissions and transit time. And both can be reduced by picking the right services. It is not always the case however, some services with low CO2 come with higher transit time. You can see orange circles on the very left of this graph as well.
Bottom line is, during the tender process, overlaying the right granularity of CO2 data can help you set your company on the right track, to meet you CSR goals. You then need to execute it well, in your spot procurement process.
Spot — Know your vessels.
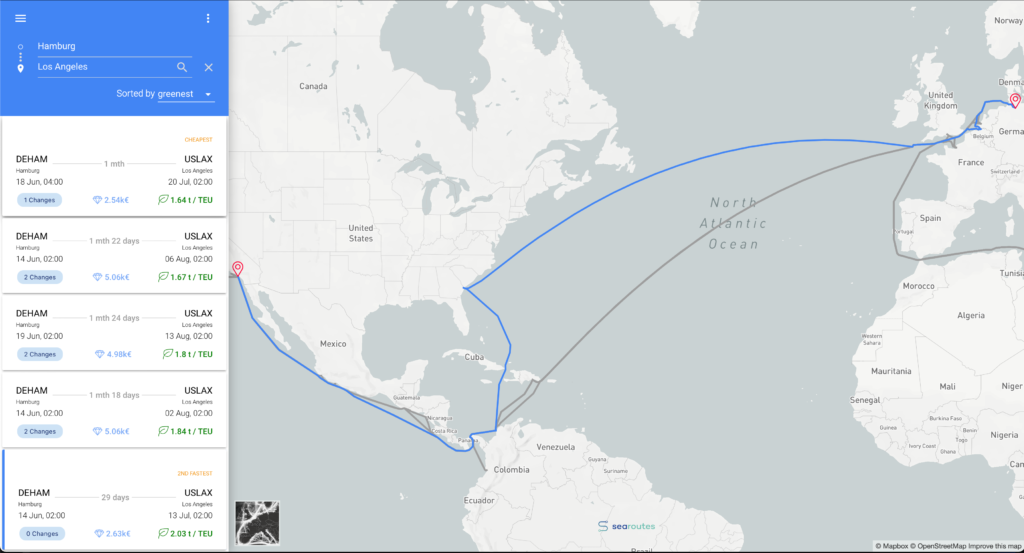
After CSR has set targets of CO2 emissions per trade lane, or port pair, you are left to execute, as part of the procurement process. When buying freight, your main worry is the cost, to make sure your lead times are respected, and that you find space on vessels (especially these days). However, CO2 values vary drastically, depending on the service you choose, or which vessel operates a particular loop. You can see for instance on the pictures below, a few schedules for 3 carriers between Hamburg (DEHAM) and Los Angeles (USLAX) coming from our Searoutes’ planner tool.
While reporting transit times, indicative price, carrier and number of transshipment, we also report CO2 values per TEU (in green). For the same carrier, the delta in CO2 between services on that port pair can be as large as 81%. Choose wisely!
Let’s look at comparable transit times. We see on the picture below, the 4th option down which shows a service with 2 transshipments and 29 days of transit time. That service emits 1.27 ton CO2 / TEU on average.

On the picture below, a direct rotation with no transshipment shows 2.03 ton CO2 / TEU with the same transit time of 29 days. That’s an increase of 60%!!

Why does a “direct” service emit more CO2? That’s related to the actual length of the rotation (the intermediate stops), the size of the vessel and its speed.
Assuming procurement has made wise decisions over the quarter, in line with the CO2 emission goals you set during the tender, comes reporting at the end of the quarter. This is a time when you check how you’ve performed against your targets, and start adjusting your CO2 strategy.
Report — Know your worst CO2 performers.
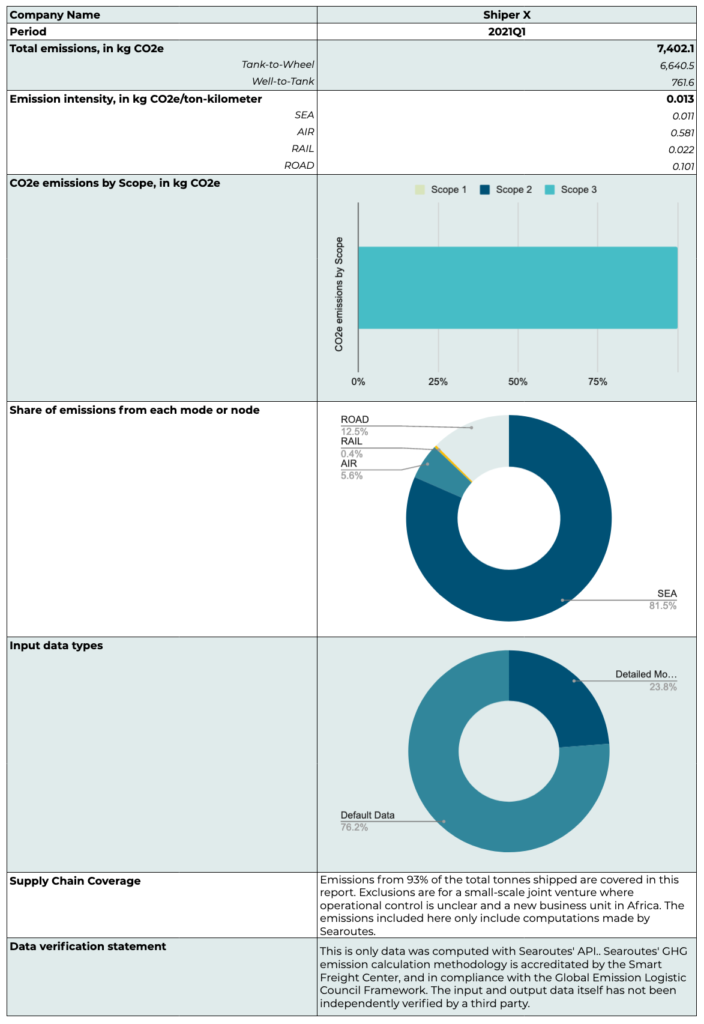
Once the month or the quarter is over, it’s time to review procurement decisions, measure relevant KPIs and confront them to the objectives set at the beginning of the quarter. CO2 KPIs often involve the computation of the intensity factors in kg CO2e / ton.km. It is a measure of how much CO2 is emitted, considering the weight of all the goods transported, and the kilometers traveled. The normalization to ton.km allows one to compare values month to month, independently of if volumes or distances have changed (and they most surely did!).
Typically, the monthly report is constructed in the same fashion as the example below 👇

The intensity factor however, does not have any causality link between a CSR or procurement decision, and the actual increase or decrease of that factor. The only way to find out what worked, is to go one level below, look at which shipment incurred abnormally high emissions, and what can be done to remedy it.
One avenue to explore, is how does your footprint compare to averages on the same port pair, or trade lane. Or how does your intensity factor for that port pair compare to last year’s? Isolate the long tail, the outliers, the shipments with significantly higher emissions than the benchmark. You can then look at the offering of other carriers, and put in place policies to frame these shipments in the next tender.
Carbon Footprint, CO2 emissions, Green shipping, Logistic, Shipping