
Sea vs. Air Freight, Truck vs. Rail: How to Track and Reduce Carbon Emissions in Freight – transport modes compared
Introduction
Global supply chains are under pressure to reduce shipping CO₂e emissions and improve sustainability. But with so many transport options—rail, road, air, and ocean—how do you choose the most efficient and eco-friendly solution?
In this guide, we’ll break down:
- How to track emissions for each transport mode
- A clear comparison of carbon footprints: ship vs. plane, truck vs. rail, and more
- Best practices for CO₂ reporting and logistics emission tracking
- Actionable strategies to reduce shipping emissions
Use our comparison table to quickly assess which mode aligns with your sustainability goals and operational needs.
Why Tracking Carbon Emissions Matters
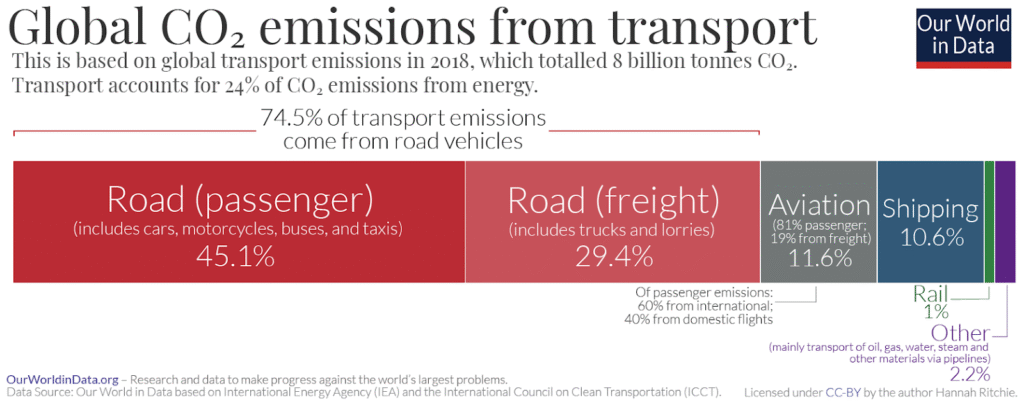
Transport accounts for around one-fifth of global CO₂ emissions — up to 24% if we only consider CO₂ emissions from energy (World in Data).
Accurate carbon emissions tracking helps businesses:
- ✅ Comply with CO₂ reporting regulations
- ✅ Optimize routes to reduce shipping emissions
- ✅ Make data-driven decisions for carbon footprint reduction
How to Track Carbon Emissions Across Shipping Modes
1. Collect Precise Data for Accurate Reporting
To ensure accurate emissions tracking, gather detailed information about your shipments:
- Mode of transport: Ocean, air, road, rail, and barge
- Vehicle type: Container ship, bulk carrier, general cargo ship, aircraft, freight train, truck, and multiple barge types.
- Fuel type: Diesel, electricity, biofuels, or any alternative fuel.
- Route details: Exact points of transshipment, distances, and elevation changes
- Load capacity: Cargo weight and vehicle size
Tip: Use geocoding tools (like Searoutes’ free Geocoding plug-in) to calculate with precise distances and optimize routes.
2. Plan with Optimized Routes and Modes
Leverage advanced modeling technology to:
- Optimize routes
- Choose the most efficient mode of transport for each shipment
- Select low-carbon fuels and greener transport partners
Example: Switching from trucks to rail for long-distance freight can reduce emissions by up to 75% (Association of American Railroads, 2023).
3. Reduce Emissions with Continuous Tracking
Implement real-time carbon emissions tracking to:
- Monitor progress toward sustainability goals
- Identify inefficiencies and areas for improvement
- Adjust strategies based on data-driven insights
Tools like Searoutes provide vessel-specific CO₂e calculations, enabling continuous improvement in emissions reduction.
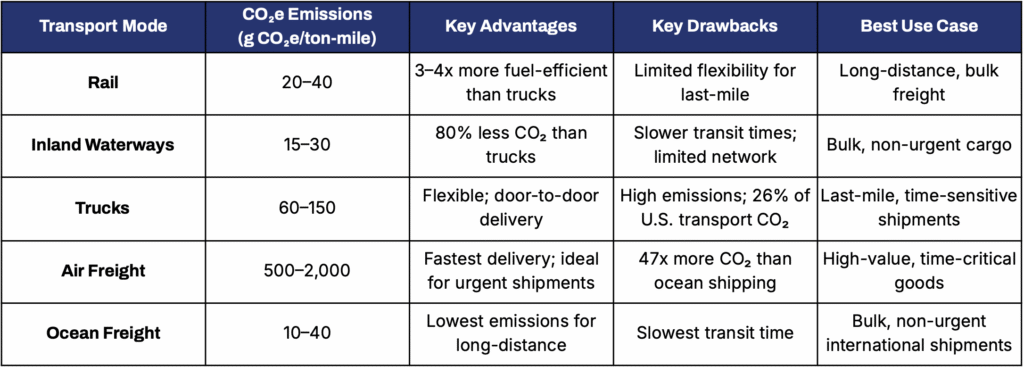
Carbon Footprint Comparison by Transport Mode
How to Reduce Your Freight Carbon Footprint
- Switch Modes: Use ocean instead of air, and rail or barge instead of road, for low-carbon transport.
- Optimize Routes: Reduce truck CO₂e emissions per mile with optimised routes logistics planning
- Upgrade Fleets: Invest in alternative fuels and target greener vehicles
- Offset Emissions: Partner with carbon offset programs.
Conclusion
Choosing the right transport mode is a balance between transit time, cost, and sustainability. By leveraging carbon emissions tracking tools, optimizing routes, and selecting the most efficient modes, businesses can cut costs and emissions.
Ready to track your emissions? Explore tools like Searoutes for real-time CO₂e reporting and start your journey toward carbon-neutral logistics.
Which transport mode are you currently using, and what challenges do you face in reducing emissions? Let’s discuss solutions!
Air freight carbon footprint, Alternative fuels for freight, Carbon-neutral shipping, CO₂ reporting for freight, CO₂e emissions by transport mode, CO₂e per ton-mile comparison, Eco-friendly freight transport, Emissions tracking tools, Freight carbon footprint reduction, Freight emissions comparison, Green logistics solutions, Low-carbon logistics, Ocean freight sustainability, Rail vs. truck emissions, Sustainable transport options