
Carbon Reduction Strategies in the Supply Chain: Measure, Optimise, and Decarbonise
Why Carbon Reduction Strategies Are Critical for Modern Logistics
Global logistics operations account for 3% of worldwide greenhouse gas emissions—comparable to the entire aviation sector. As of 2025, CO₂ emissions are rising again due to post-pandemic economic recovery and increased energy demand, making precise measurement and proactive reduction more urgent than ever (sustainabilityglobal.org).
Without robust emissions tracking, companies cannot effectively meet sustainability goals or comply with evolving regulations like the EU Emissions Trading System (ETS) and
FuelEU Maritime, which will expand in 2026. The focus is shifting from reporting to actionable decarbonization across the supply chain.
THere’s your revised article, fully optimized for carbon reduction strategies in the supply chain while minimizing the focus on Scope 3. All links and structure are preserved, and the content is now in English.
Carbon Reduction Strategies in the Supply Chain: Measure, Optimize, and Decarbonize
Why Carbon Reduction Strategies Are Critical for Modern Logistics
Global logistics operations account for 3% of worldwide greenhouse gas emissions—comparable to the entire aviation sector. As of 2025, CO₂ emissions are rising again due to post-pandemic economic recovery and increased energy demand, making precise measurement and proactive reduction more urgent than ever (sustainabilityglobal.org).
Without robust emissions tracking, companies cannot effectively meet sustainability goals or comply with evolving regulations like the EU Emissions Trading System (ETS) and FuelEU Maritime, which will expand in 2026. The focus is shifting from reporting to actionable decarbonization across the supply chain.
The Problem with Traditional Emissions Calculation
Traditional emissions calculations often rely on outdated methodologies and industry averages, leading to significant inaccuracies. One persistent issue is the fallacy of averages—using generic trade lane distances that fail to reflect real-world variability.
For example, a route between Asia and Europe can vary dramatically depending on whether a vessel uses the Suez Canal or the longer Cape of Good Hope route. This difference can add thousands of nautical miles, directly impacting fuel consumption and CO₂ emissions. Port call sequences also matter: a stop at Jebel Ali can add 1,442 nautical miles to an Asia-Europe journey.
Relying on averages obscures these critical variations, undermining the accuracy of emissions reporting and limiting the effectiveness of reduction strategies.
Other common challenges include:
- Inability to compare carriers and routes effectively
- Lack of real-time data for procurement decisions
- Difficulty identifying specific areas for improvement
Advanced tools, such as those offered by Searoutes, address these gaps by providing granular, vessel-specific dataand real-time analytics, ensuring calculations reflect actual operational conditions.
How Advanced Carbon Reduction Tools Work
Three-Step Calculation Process
- Trade Lane Analysis: Identifies available services for specific port pairs and the fleet operating on each route.
- Distance and Route Calculation: Measures actual distances, including intermediate stops and transshipments, using AIS data specific to each journey.
- Emission Factor Application: Uses an extensive vessel specification database for cargo-weighted, vessel-specific emission factors.
Data Sources and Methodologies
- Primary Data: Direct carrier measurements (rare, inconsistent methodologies, and do not account for alliances and VSAs).
- Default Data: Industry averages (widely available but inaccurate).
- Modeled Data: Granular, vessel-specific calculations (most accurate for comparison and decision-making).
Searoutes stands out by providing the most precise modeled data, enabling accurate emissions tracking and optimization.Searoutes stands out by offering the most accurate modeled data, enabling precise emissions tracking and optimisation.
Key Benefits of Carbon Reduction Tools
Comprehensive Multi-Modal Tracking
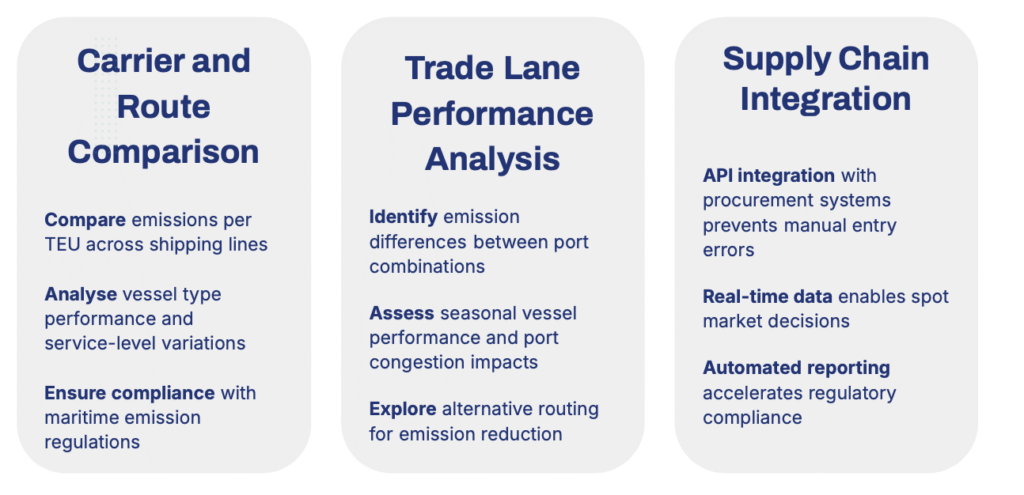
Advanced calculators provide visibility across maritime, road, rail, and air freight, as well as last-mile delivery and intermodal connections. This holistic view ensures companies can track emissions across the entire supply chain, making it easier to identify inefficiencies and opportunities for improvement.
Implementing Effective Carbon Reduction Programs
Optimizing the Tender Process
Advanced carbon reduction tools empower procurement teams to set ambitious CO₂ targets for each trade lane during carrier negotiations. By comparing emission profiles alongside traditional metrics (cost, transit time), companies can identify carriers with consistently low-emission performance.
This approach supports sustainability goals and embeds environmental requirements directly into vendor contracts, making them a core part of business agreements.
Spot Procurement and Real-Time Decision-Making
For spot procurement, real-time intelligence is crucial. Tools like Searoutes provide vessel-specific CO₂ emission data for individual shipments, enabling logistics managers to make informed decisions that balance transit time with emission reduction.
These tools also offer alternative routing suggestions, helping companies select the most efficient and sustainable options for each shipment. This level of detail ensures that every procurement decision contributes to broader emission reduction objectives.
Performance Reporting and Analysis
Advanced calculators allow companies to:
- Calculate monthly intensity factors (e.g., kg CO₂e per ton-km).
- Benchmark performance against industry standards and past results.
- Identify high-emission outliers requiring attention.
- Assess the ROI of emission reduction initiatives.
By integrating these insights into ongoing operations, companies can continuously refine their strategies and achieve long-term sustainability targets.
Future-Proofing Logistics Emission Management
Regulatory Compliance Preparation
The regulatory landscape is evolving rapidly, with EU ETS and FuelEU Maritime set to require 100% emissions reporting by 2026. Companies must stay ahead by adopting flexible calculation methodologies that adapt to new requirements and support various reporting standards.
Proactive monitoring of regulatory changes and integration with compliance management systems will be essential for maintaining compliance and avoiding penalties.
Technological Evolution
The future of emissions management lies in technological advancements, such as Searoutes’ machine learning algorithms, which improve calculation accuracy and enable more precise emissions tracking. By leveraging these innovations, companies can enhance their emissions management strategies and drive continuous improvement in sustainability performance.
Conclusion
Implementing advanced carbon reduction tools is a critical step toward sustainable logistics. By embracing accurate measurement and data-driven decision-making, companies can reduce emissions, maintain operational efficiency, and ensure regulatory compliance.
Ready to optimize your carbon reduction strategy? Book a meeting with our team to discover how Searoutes’ Freight Emissions solutions can transform your logistics operations and help you stay ahead of the 2026 ETS evolution.
Best tools for supply chain decarbonization, Carbon footprint measurement, Carbon reduction in supply chain, FuelEU Maritime regulations, How to reduce carbon emissions in logistics, Logistics emissions tracking, Low-carbon logistics, Maritime emissions reduction, Real-time emissions data, Route optimization for emissions, Supply Chain Sustainability