For shippers and cargo owners
Your carrier prices carbon on a fleet average. You pay the buffer.
Searoutes gives you the vessel-level number behind every EU ETS surcharge, so you can check what you actually owe and recover what you don't.Vessel-level EU ETScost per shipment
GLEC + ISO 14083audit-ready methodology
Data + advisoryprocurement support
Trusted by leading freight forwarders, carriers and cargo owners
The EU ETS line on your invoice isn't your shipment.
Carriers price EU ETS surcharges on fleet averages, then add a buffer. Forwarders add another before the bill reaches you. By the time it lands on a procurement desk, it matches no real voyage.Searoutes holds the vessel-level number behind each sailing, so the gap between what you're billed and what your shipments actually owe becomes something you can check, and recover.
The friction
What you're up against
EU ETS surcharges built on fleet averages plus a buffer, invoiced quarter after quarter, with no independent way to check them.
Carrier bills you can't tie back to what your shipments actually emitted or owe under the scheme.
The same lane priced very differently by carrier, with the carbon variance buried inside freight cost.
Scope 3 and CSRD reporting built on those same carrier averages, the kind of number that won't survive scrutiny.
The unlock
How Searoutes helps you
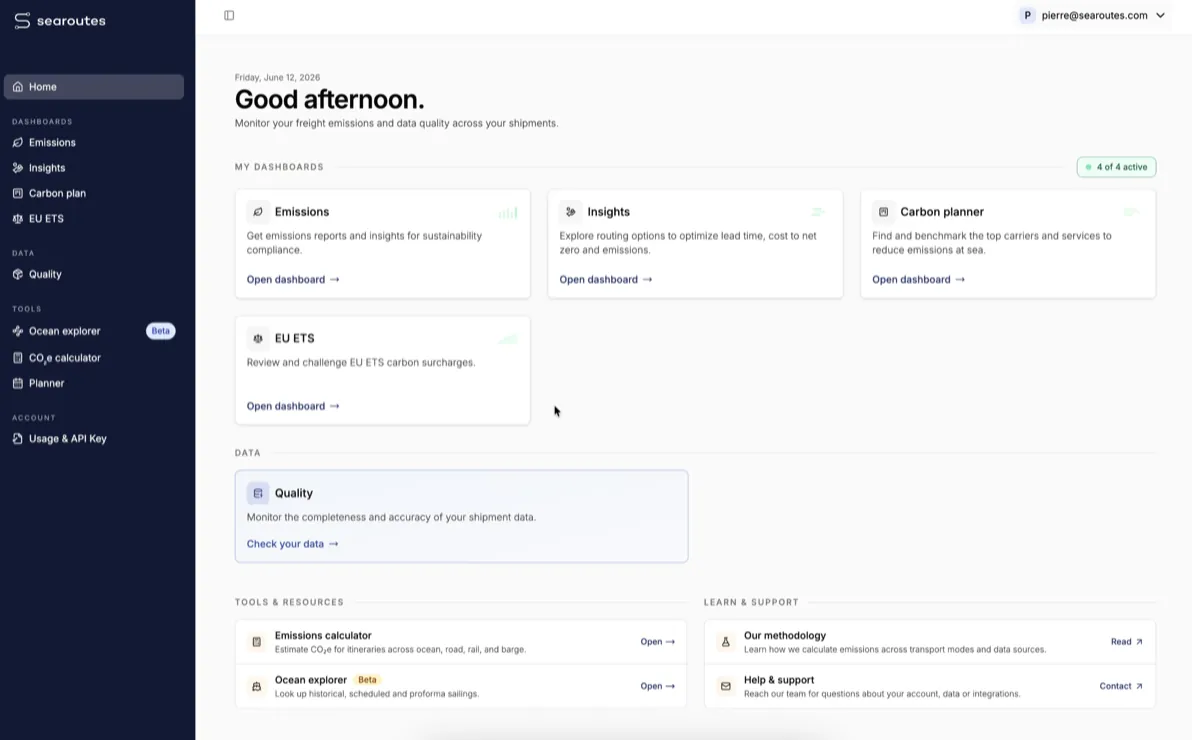
See the vessel-level EU ETS cost behind every voyage. The actual figure, not the carrier's average.
Audit each surcharge against real emissions and recover what you've been overcharged.
Compare carriers and services on carbon cost per lane, and route to cut your exposure.
Work the recovery with our procurement advisors alongside your team, delivered as tracked ROI, not a dashboard.
The freight emissions data you were waiting for
The benefits
Key benefits for shippers and cargo owners

Accuracy you can audit
GLEC + ISO 14083 methodology. The same granularity that makes a recovery hold up makes your scope 3 defensible.
Leverage you can act on
Surcharge variance by carrier. On the same lane, one carrier can charge materially more for carbon than another. See the gap before you book.
Exposure by lane. Find where your heaviest EU ETS cost sits, instead of leaving it buried in freight cost.
A recovery worked with advisors. The gap turned into a negotiation brief and a tracked outcome, not just a report.
EU ETS analysis
A shipper moving 30,000 TEUs has an average ETS opportunity of $2M
Carrier ETS surcharges rarely match real emissions. We calculate the actual cost per trade lane, so you can negotiate the difference.−56.2%
Total ETS delta$2.9M
Identified across 34,882 TEUs−55.5%
Adjusted by carrier public surchargeTestimonials
Our customers’ perspective

Searoutes' API gave us the accuracy we needed to achieve FRET21 certification and track progress toward our 25% carbon reduction target under SBTi.
Vincent GelernterHead of Global Transportation

Searoutes combines scientific rigor, technical agility, and outstanding relational quality. It is a credible, compliant, and scalable solution perfectly suited to the environmental challenges of agri-food supply chains. I recommend it to any company seeking to turn the carbon constraint into a lever for competitive differentiation.
Asma El FaliCommercial & Marketing Director, Maroc Fruit Board (MFB) and FreshTrack
Searoutes has enabled us to better visualise our complex Freight Emissions, [..] and helped develop our future strategies.
Zane TomlinsonClimate Change and Sustainability Advisor

Book a demo