Freight emissions
Carbon has a price. Averages have a cost.
Carriers price carbon based on fleet averages. Forwarders add a buffer. By the time the invoice reaches you, you're paying two to three times your actual exposure. Searoutes shows you the gap — shipment by shipment, carrier by carrier, lane by lane.GLEC + ISO 14083 certified
All modes — ocean · road · air · rail
EU ETS ready
Trusted by leading freight forwarders, carriers and cargo owners
Your carrier uses an average. Audit them.
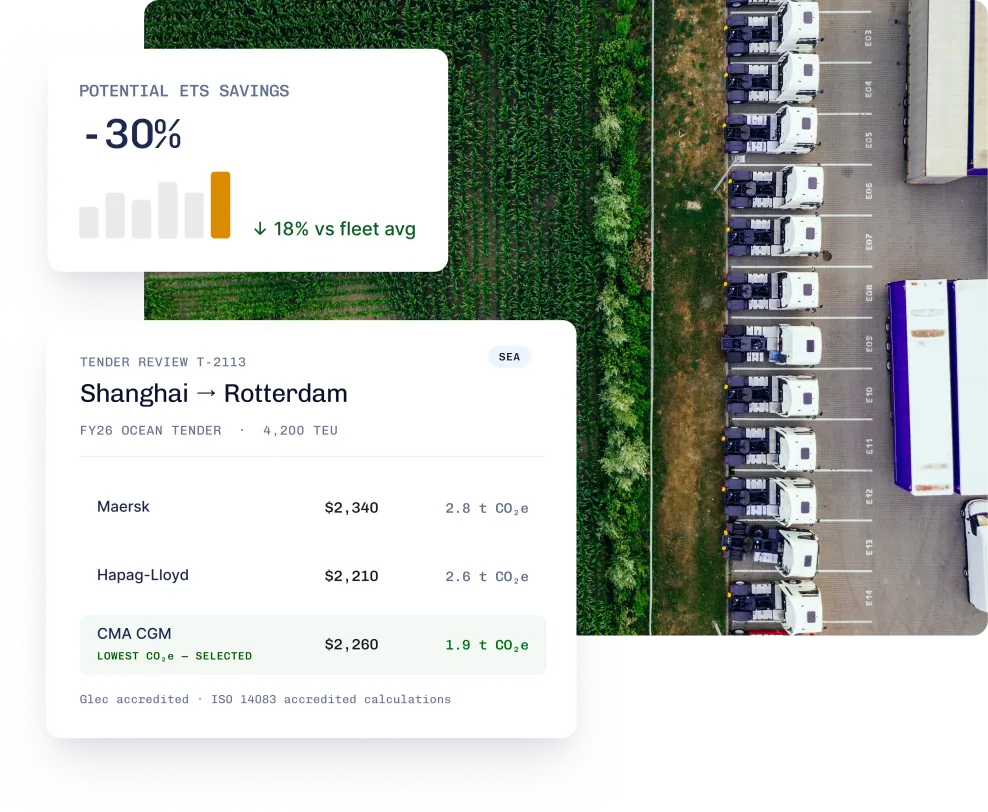
Vessel-level ETS, not fleet averageYour carrier calculates ETS on fleet average emissions. Searoutes calculates it on the vessel that carried your cargo. The difference is your overcharge baseline.
Surcharge audit by laneCompare what each carrier charges against actual ETS exposure on that lane. Identify which carriers are charging a fair pass-through and which are not.
Portfolio exposure, not samplesRun the audit across your full shipment history. Quantify total ETS overcharge in dollars, by carrier, by lane, by quarter.
Key benefits
Why use Searoutes for freight emissions?
Accuracy you can trust
GLEC & ISO 14083-certified. Including more specific calculations like EU ETS.
Scope 3 transparency. Shipment-level emissions details, with full visibility into routes, modes and assets.
Cross-modal coverage: Ocean, road, air, rail. Carrier-level, vessel-level, flight-number-level. Not averages, actual routes.

Roquette leverages Searoutes' API for accurate emissions tracking and supply chain decarbonisation. This enabled FRET21 certification whilst supporting 25% carbon footprint reduction by 2030 under SBTi.
Vincent GelernterHead of Global Transportation
EU ETS analysis
Unlocking $2.9M ETS opportunity across 34,882 TEUs
Carrier ETS surcharges rarely match real emissions. We calculate the actual cost per trade lane — so you can negotiate the difference.−56.2%
Total ETS delta$2.9M
Identified across 34,882 TEUs−55.5%
Adjusted by carrier public surchargeThe freight emissions data you were waiting for
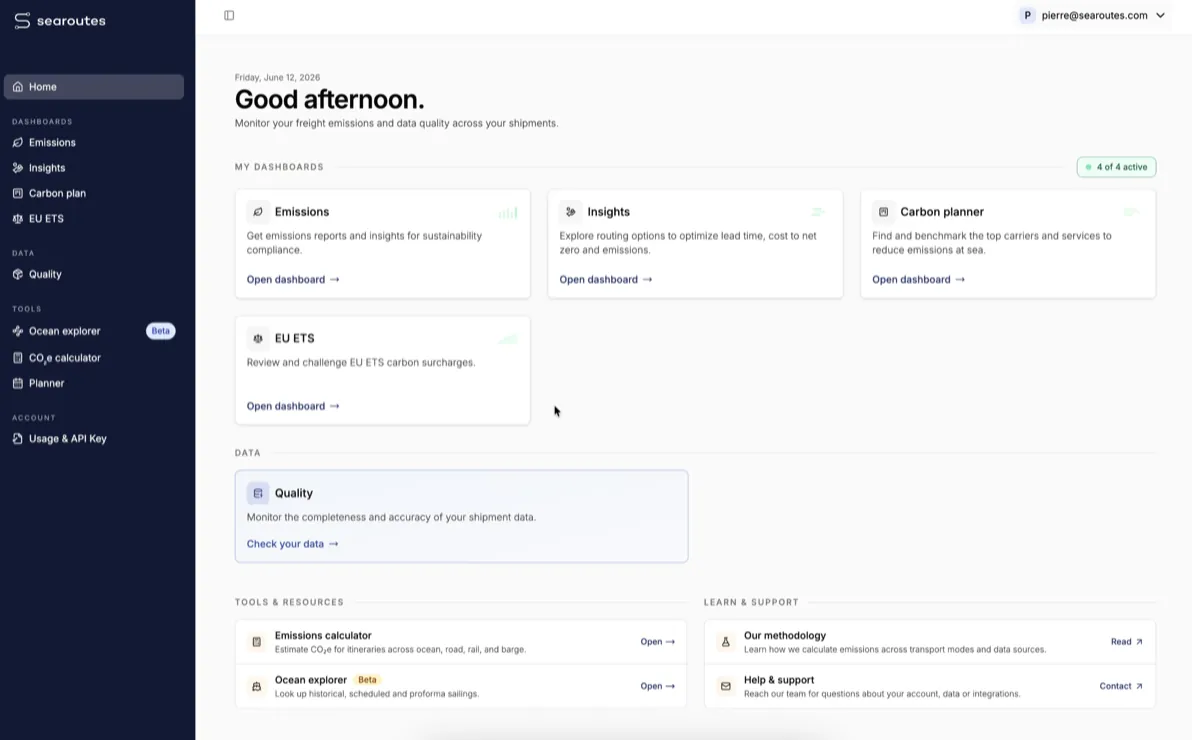
How it works
From API key to insights
Testimonials
Our customers’ perspective

Around 60-70% of carriers are working actively with us based on Searoutes’ data. It is leading to freight rate savings when correctly applied.
Marco HahnGlobal logistics procurement

Searoutes' API gave us the accuracy we needed to achieve FRET21 certification and track progress toward our 25% carbon reduction target under SBTi.
Vincent GelernterHead of Global Transportation
Searoutes combines scientific rigor, technical agility, and outstanding relational quality. It is a credible, compliant, and scalable solution perfectly suited to the environmental challenges of agri-food supply chains. I recommend it to any company seeking to turn the carbon constraint into a lever for competitive differentiation.
Asma El FaliCommercial & Marketing Director, Maroc Fruit Board (MFB) and FreshTrack
FAQs