EU ETS
The Complete Guide to EU ETS: Part 2
Searoutes team
29 April 2024 · Updated 17 March 2026
The European maritime sector has been operating under the European Union’s emissions trading system (EU ETS) for four months now. The EU ETS calls for the sector to slash GHG emissions by 55% by 2030 and to become climate-neutral by 2050.
The EU is taking a phased-in approach to compliance, meaning that carriers and shippers might not immediately feel the full impact that the regulatory scheme will have on freight costs. But as coverage ramps to 100% of covered emissions in 2026 — with methane and nitrous oxide joining the scheme the same year and offshore ships following in 2027 — Searoutes estimates that shippers could expect their freight costs to increase by as much as 5% in that same timeframe.
However, shippers need not feel threatened by how much freight costs might increase under the EU ETS. They can adopt several strategies to ensure carrier accountability and mitigate unnecessary costs. By leveraging technology, gaining insight into emissions patterns, and playing smart in procurement, shippers can stay ahead of the curve and safeguard their bottom line.
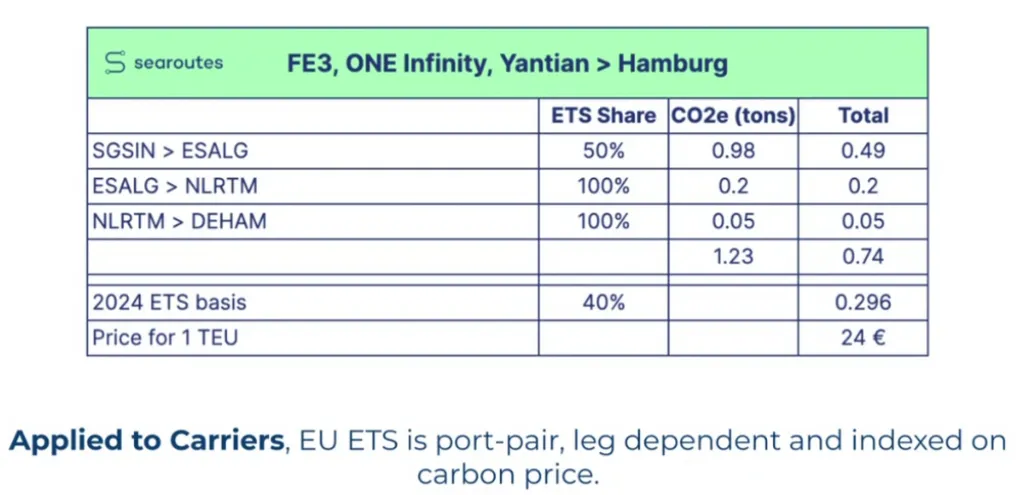 A carrier might calculate the emissions cost using a rationale similar to the one in the chart above. For instance, ONE might determine how much emissions are emitted between the Port of Singapore and the Port of Algeciras in Spain. Since the leg starts outside the EU and ends at an EU port, only 50% of the vessel’s emissions are taxable. The legs between Algeciras and Rotterdam and Rotterdam and Hamburg would have vessel emissions that are 100% taxable.
Since only 40% of a vessel’s overall emissions will count in the EU ETS regulatory scheme for the maritime sector in 2024, the total volume of carbon emissions is calculated. Then that volume is multiplied by the cost of carbon.
However, shippers might see different numbers and figures, such as those in the chart below:
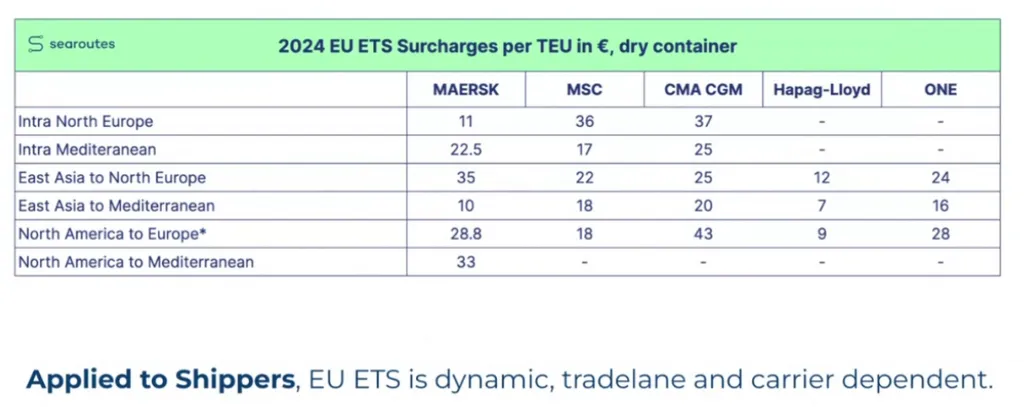 In this chart, a carrier might not define surcharges by leg but rather by region. As a result, a shipper might view these surcharges as being at a fixed price per carrier and per trade lane, even though other factors, such as the port pair and the vessel, will impact the final price.
To add to this complexity, global events and disruptions may further impact emissions pricing. For instance, the diversion of vessels from the Suez Canal to around the Cape of Good Hope means that a vessel is traveling longer distances — and emitting more emissions. Carriers will take this into account as they calculate what shippers will be paying into the EU ETS.
The above two charts teach shippers that they need to understand how emissions prices are calculated to ensure that they’re not overpaying for the EU ETS.
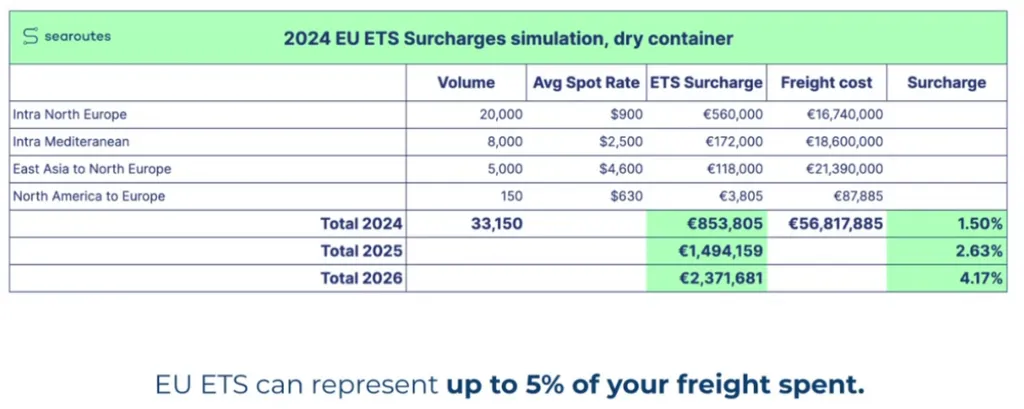 Indeed, Searoutes’ simulation above, which shows how much emissions pricing would affect a dry container along varying routes, illustrates a likely outcome: over time, the EU ETS can represent up to 5% of a company’s freight spend by the time the ETS is fully implemented.
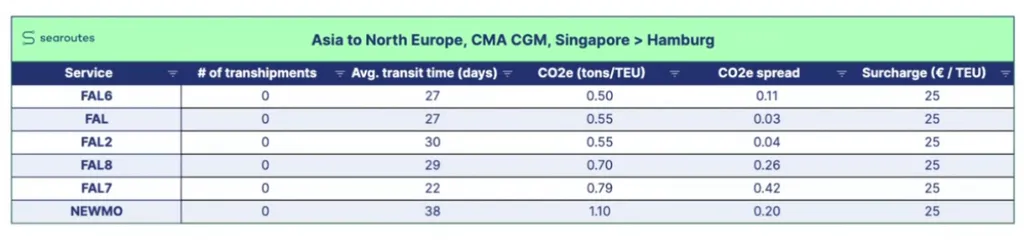 For example, as illustrated in the Searoutes chart above, CMA CGM offers different services between Singapore and Hamburg. The services differ in how much emissions are emitted but the surcharge is the same regardless of how much is emitted.
EU ETS Surcharges: With Surcharges Set to Increase Over Time, Shippers Have Questions
As Searoutes explained in March, to help the maritime shipping sector ease into the EU ETS, the EU has adopted an approach where carriers will face increasing emissions reduction goal milestones over time. In 2024, only 40% of the emissions that carriers emit will be subject to the EU ETS. But that compliance level increases with each passing year — 70% in 2025 — so that by 2026, 100% of emissions that carriers emit will be subject to the EU ETS. This phased-in approach is significant for several reasons.- First, the costs to comply with the regulatory scheme will seem cheaper — at first. But over time, expect costs to become more expensive as the percentage of emissions falling under the regulation increases. That’s why it’s important for shippers to tackle ETS pricing now rather than later when costs are higher.
- Second, the EU ETS for the maritime sector will expand the type of emissions that fall under the rule, from carbon dioxide to methane and nitrous-oxide emissions from 2026. This could also result in increased costs.
- Third, the regulations pertain only to larger ships now but will apply to smaller ships in the future.
With EU ETS Surcharges in Place, How Can Shippers Ensure Carrier Accountability?
What’s different about the EU ETS is that shippers will need to pay upfront for what carriers will pay a year later. To understand this point, think about an Amazon gift card: when someone buys a $50 gift card from Amazon, it essentially translates into Amazon getting a loan from the buyer until the gift card gets used — and that card may not be redeemed for years. Turning back to shippers, this means that shippers will have to give carriers this year the price of the ETS surcharge. Meanwhile, the EU will penalize carriers starting next year for not properly complying with the regulatory scheme. Implementing costs this way may frustrate some shippers because carriers are charging them a fee they haven’t yet paid. So, the question becomes, how can shippers mitigate these costs, and how can partnering companies — like Searoutes — help shippers navigate various mitigation strategies? The answer lies in looking into the details of how emissions prices are calculated so that shippers don’t overpay for complying with the EU ETS.EU ETS Surcharge Calculation: Three Examples
To calculate the price of the EU ETS, one looks at the emissions per tonne and then multiplies that figure by the cost of carbon. However, the cost of carbon may fluctuate as carriers are given fewer carbon allowances over time. By granting fewer carbon allowances, the price of polluting also becomes more expensive over time. How bitcoins work might be a suitable analogy to what’s described above: there is an eliminated amount of bitcoins that are released into the market, and that tightening supply of bitcoin amid rising demand can raise the price of bitcoin.
A carrier might calculate the emissions cost using a rationale similar to the one in the chart above. For instance, ONE might determine how much emissions are emitted between the Port of Singapore and the Port of Algeciras in Spain. Since the leg starts outside the EU and ends at an EU port, only 50% of the vessel’s emissions are taxable. The legs between Algeciras and Rotterdam and Rotterdam and Hamburg would have vessel emissions that are 100% taxable.
Since only 40% of a vessel’s overall emissions will count in the EU ETS regulatory scheme for the maritime sector in 2024, the total volume of carbon emissions is calculated. Then that volume is multiplied by the cost of carbon.
However, shippers might see different numbers and figures, such as those in the chart below:
In this chart, a carrier might not define surcharges by leg but rather by region. As a result, a shipper might view these surcharges as being at a fixed price per carrier and per trade lane, even though other factors, such as the port pair and the vessel, will impact the final price.
To add to this complexity, global events and disruptions may further impact emissions pricing. For instance, the diversion of vessels from the Suez Canal to around the Cape of Good Hope means that a vessel is traveling longer distances — and emitting more emissions. Carriers will take this into account as they calculate what shippers will be paying into the EU ETS.
The above two charts teach shippers that they need to understand how emissions prices are calculated to ensure that they’re not overpaying for the EU ETS.
Indeed, Searoutes’ simulation above, which shows how much emissions pricing would affect a dry container along varying routes, illustrates a likely outcome: over time, the EU ETS can represent up to 5% of a company’s freight spend by the time the ETS is fully implemented.
Three Strategies to Ensure Carrier Accountability
The charts above illustrate the potential differences in how carriers and shippers might view emissions surcharges. Carriers will be looking at comparisons between routes and vessels, while the shippers’ perspective may focus on trade lanes and carriers. Being aware of how carriers might be computing emissions surcharges is important because that knowledge can be used as a tool during the tender season to ensure that shippers are getting a fair emissions price from carriers.Gain Emissions Insight
To help determine what a shipper should be paying, shippers need to look at historical data, as well as the historical trajectories of that data. For instance, in the chart above that shows the differences by carrier in EU ETS per TEU or twenty-foot equivalent volume, the carriers’ surcharges are according to trade lanes. By default, a shipper might just look at the trade lane and assume that the emissions pricing figure is a flat fee. However, that might not be the case. Rather, an individual carrier might have several different service options for getting from Point A to Point B. Each option has differing levels of emissions output, depending on the length of time that each vessel spent at sea getting from Point A to Point B.
For example, as illustrated in the Searoutes chart above, CMA CGM offers different services between Singapore and Hamburg. The services differ in how much emissions are emitted but the surcharge is the same regardless of how much is emitted.